Proprioprosthetics
Investigating the effects of spinal cord stimulation on sensory cortex
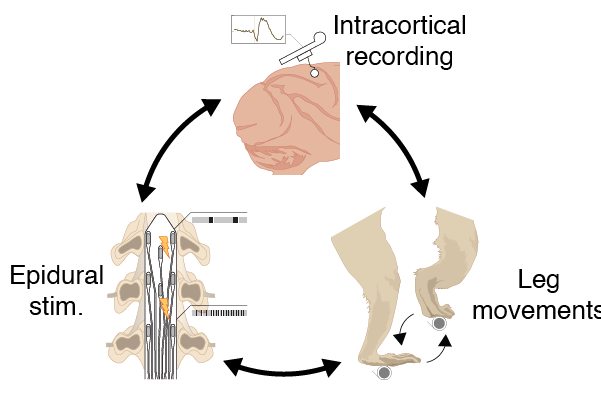
Proprioprosthetics was the main project I worked on as a graduate student. The goal was to characterize the effects of epidural electrical stimulation (EES) of the spinal cord on the activity of neurons in the primary somatosensory cortex. Rich and fast somatosensory feedback is necessary for fluid motor function. People with degraded senses of touch and proprioception, whether it is due to neurological insult, paralysis, or amputation, have severely impaired balance and dexterity. Prior work suggested that proprioceptive afferents are preferentially activated when applying EES laterally, over their point of entry into the cord. We hypothesized that recruiting these afferents with a biomimetic pattern of stimulation would induce proprioceptive illusions. If true, such an effect would demonstrate that EES can be used to provide sensory feedback to patients suffering from an amputated limb or a spinal cord injury. Towards that goal, I developed an experiment where I recorded field potentials and single neurons during both natural leg movements, simultaneously with applying EES over the lumbar spinal cord.
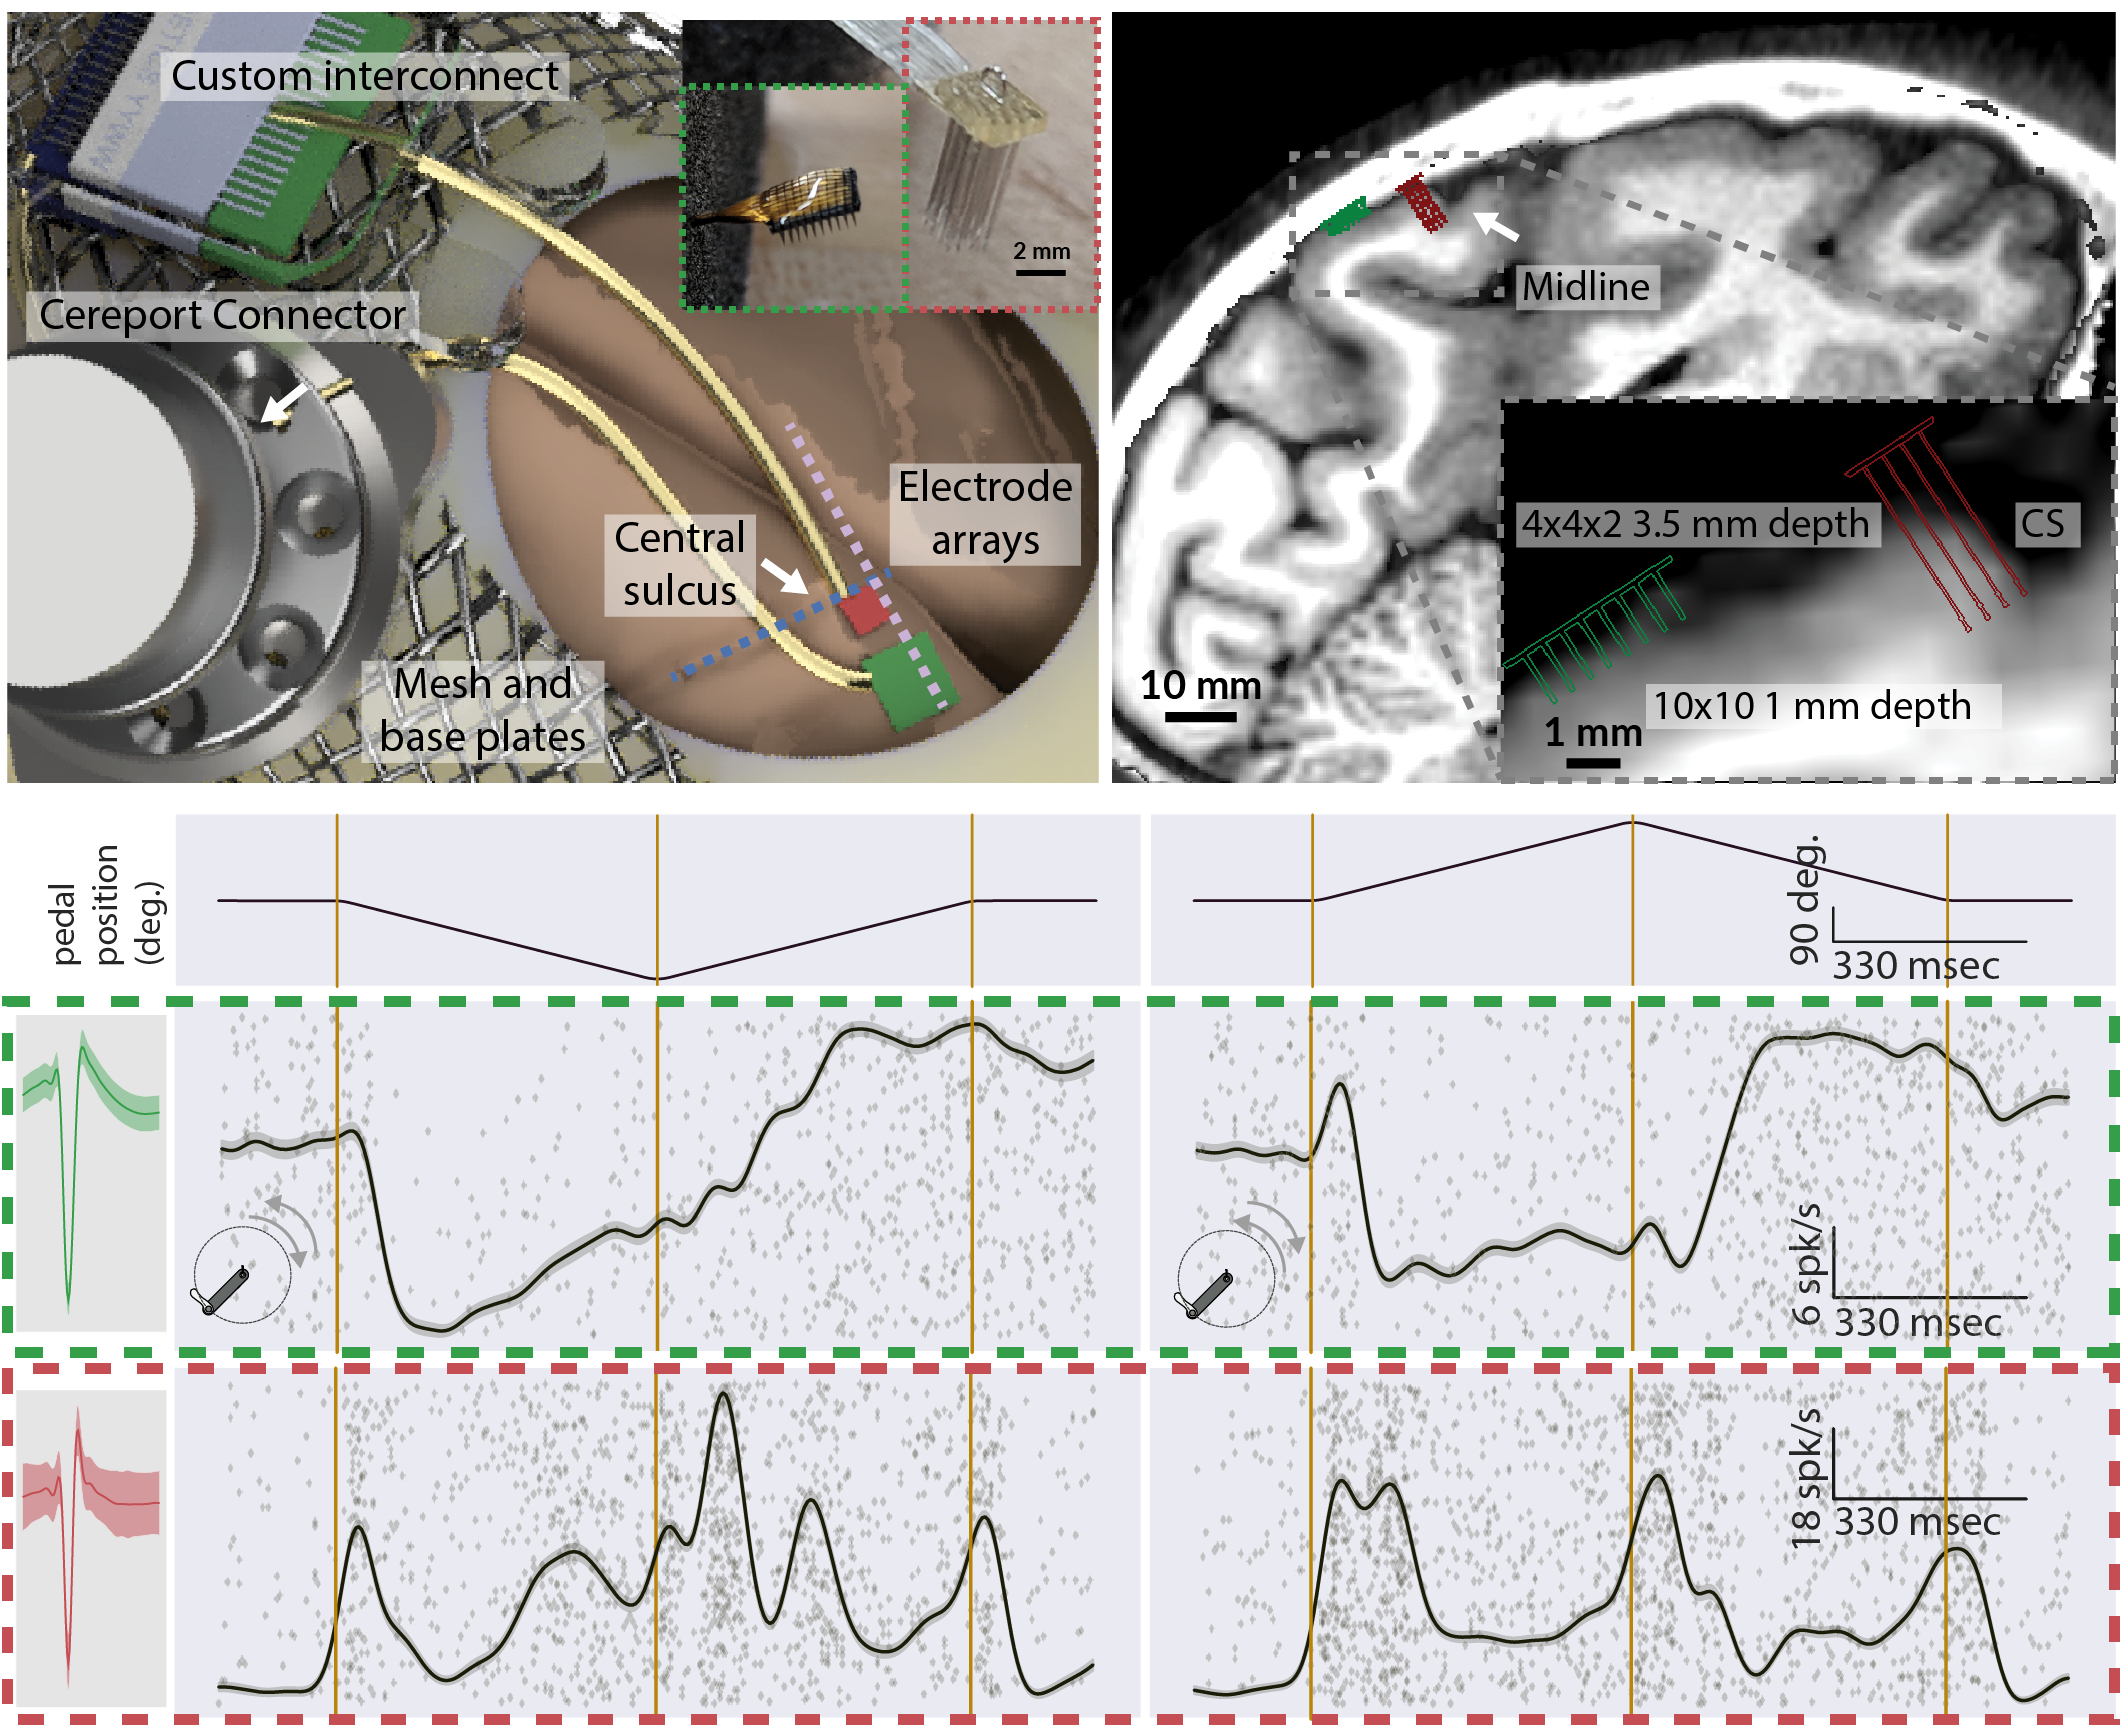
3D mockup of a dual microelectrode array implant in areas 3a and 2 of the somatosensory cortex. Insets depict the Utah and N-Form arrays, color-coded green and red, respectively. Preliminary data depicting a preoperative MRI slice with dual array implants. This supports our conclusion that modern microelectrode arrays can reach areas 2 and 3a. Single and multi-unit recordings from areas 3a and 2 using the implant during various stages of pedal positioning the leg.
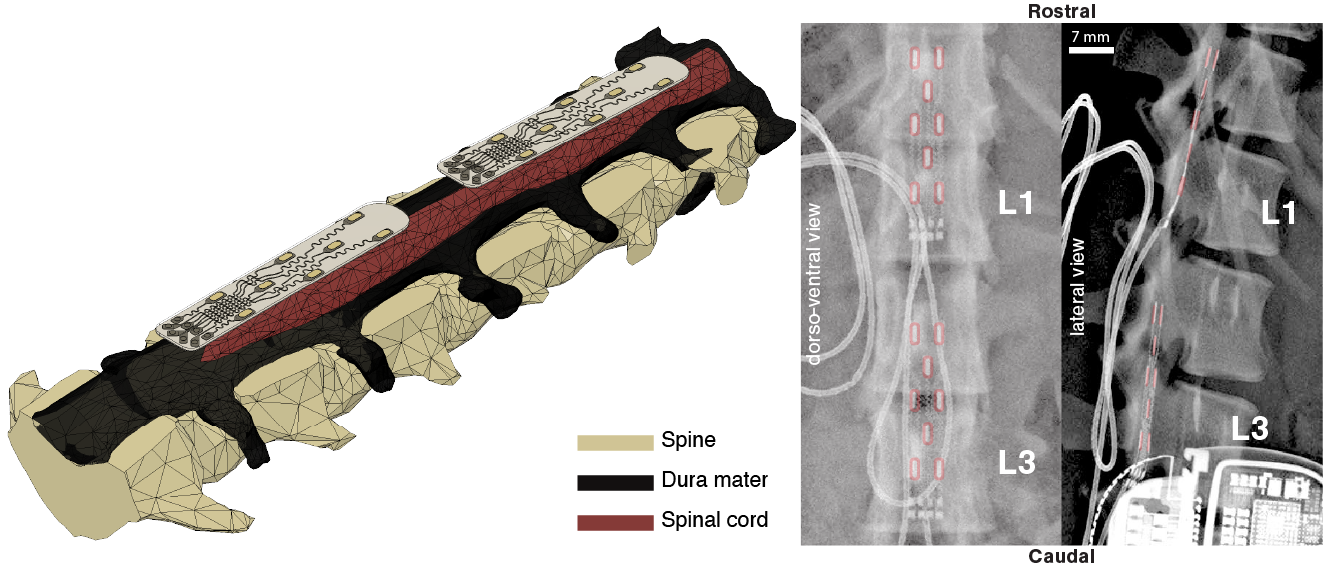
CAD schematics of spinal electrode designed for the anatomy of the lumbar spinal cord in an animal model. Postoperative x-rays confirming implant location in the dorsal epidural space of the spinal canal, over the lumbar spinal cord. False color overlays, in red, illustrate electrode locations. Other elements of the implant as marked.
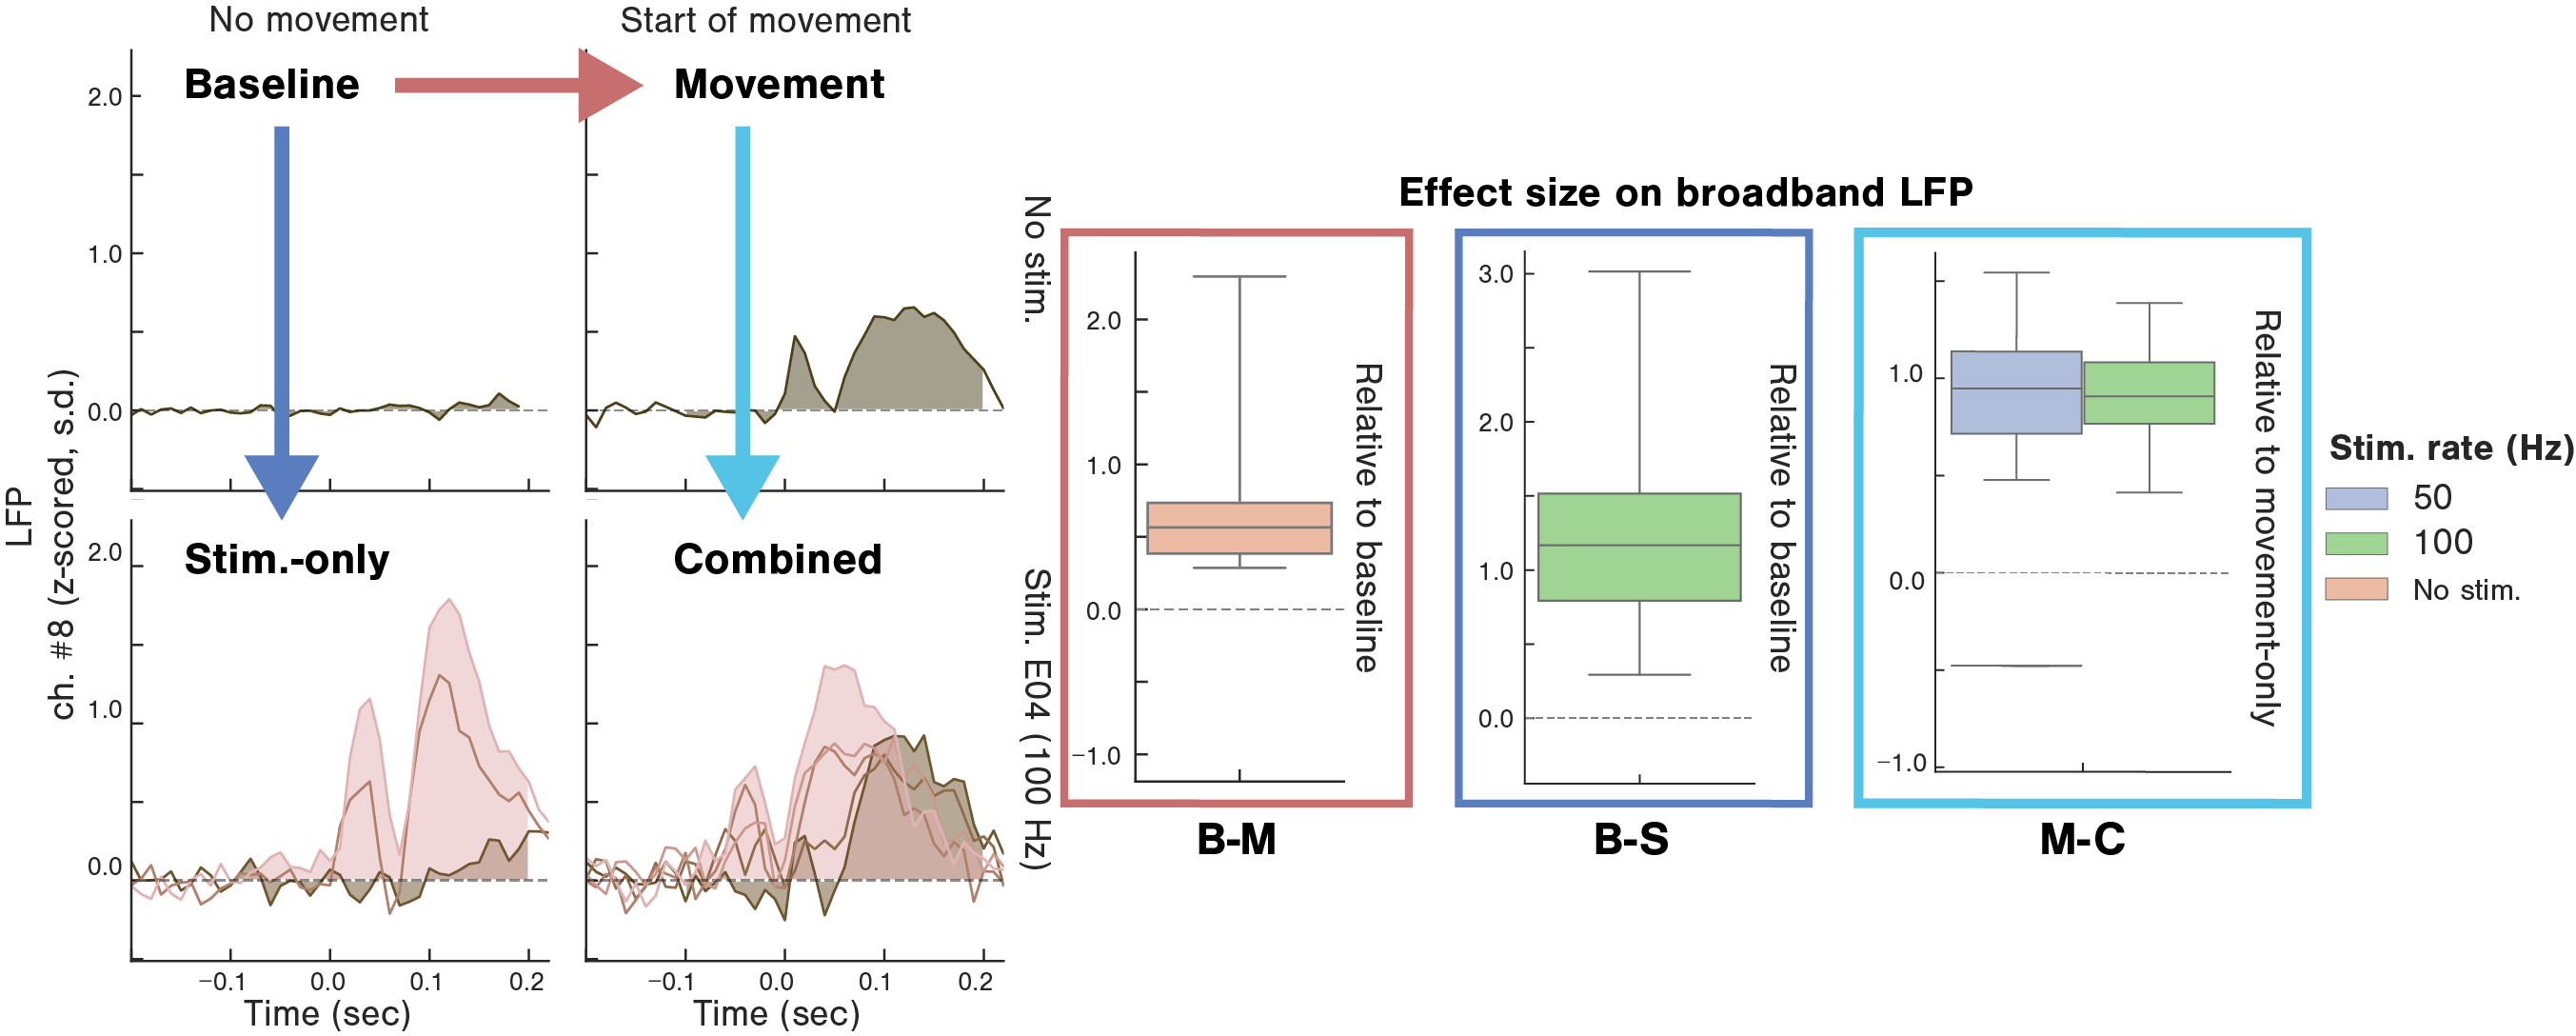
A. representative trial-averaged illustration of the broadband evoked LFP evoked from one experimental session across 4 task epochs, reflecting leg movements, spinal cord stimulation, or both (baseline B, movement-only M, stim.-only S and combined stim.-movement C). The box plots illustrate the range of effect sizes associated with each stimulus, as a measure of the size of the potential evoked by each category of stimulus.
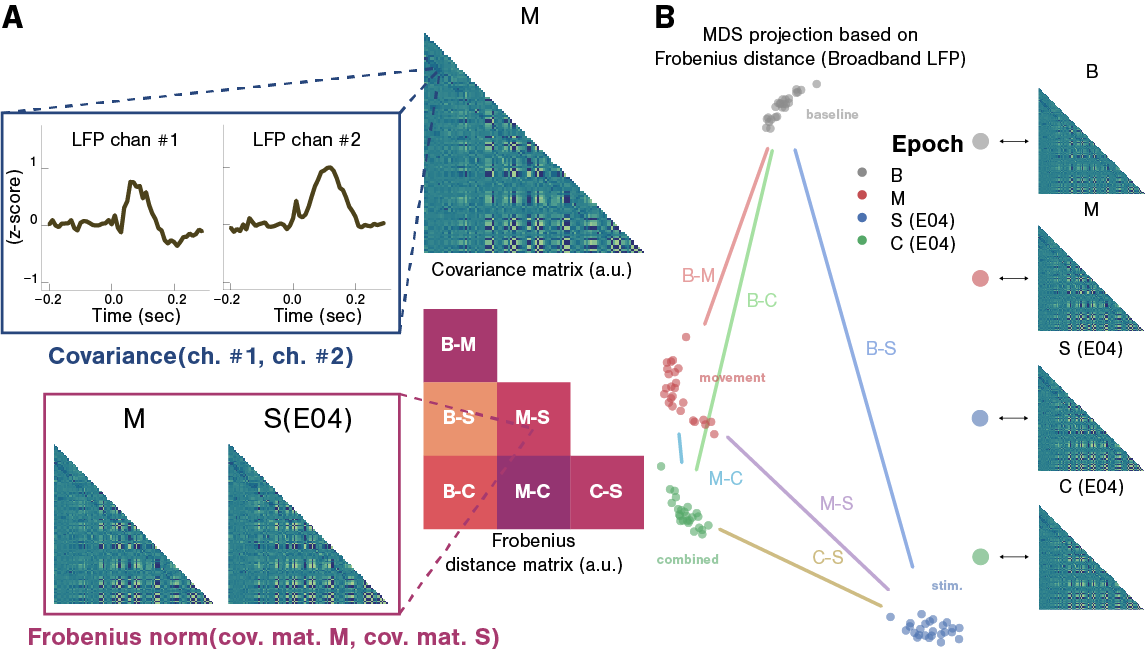
Illustrations of covariance and pairwise distance matrices calculated during the baseline (B), movement-only (M), stim.-only (S) and combined stim.-movement (C) epochs. A Conceptual illustration of the processing pipeline used to compare LFP covariation patterns across experimental epochs. For every pair of LFP recording sites, the covariance between windowed time series from each epoch is calculated and the covariance matrix (CM) is assembled. Each covariance matrix was estimated 25 times, under cross validation, for each combination of task epoch, feature frequency band and, in the case of stim.-only and stim.-movement epochs, stimulating electrode. Within the stim.-only and stim.-movement epochs, the effects of different amplitudes and pulse rates are pooled. Then, the Frobenius norm between every pair of estimated covariance matrices is calculated and the pairwise distance matrix is assembled. B Left: 2-D projection (multi-dimensional scaling) of the pairwise distance matrix depicted in panel A, shown for illustrative purposes only. Each point on this graph represents a covariance matrix derived from one of the 4 task epochs. Right: covariance matrices from one experimental session.
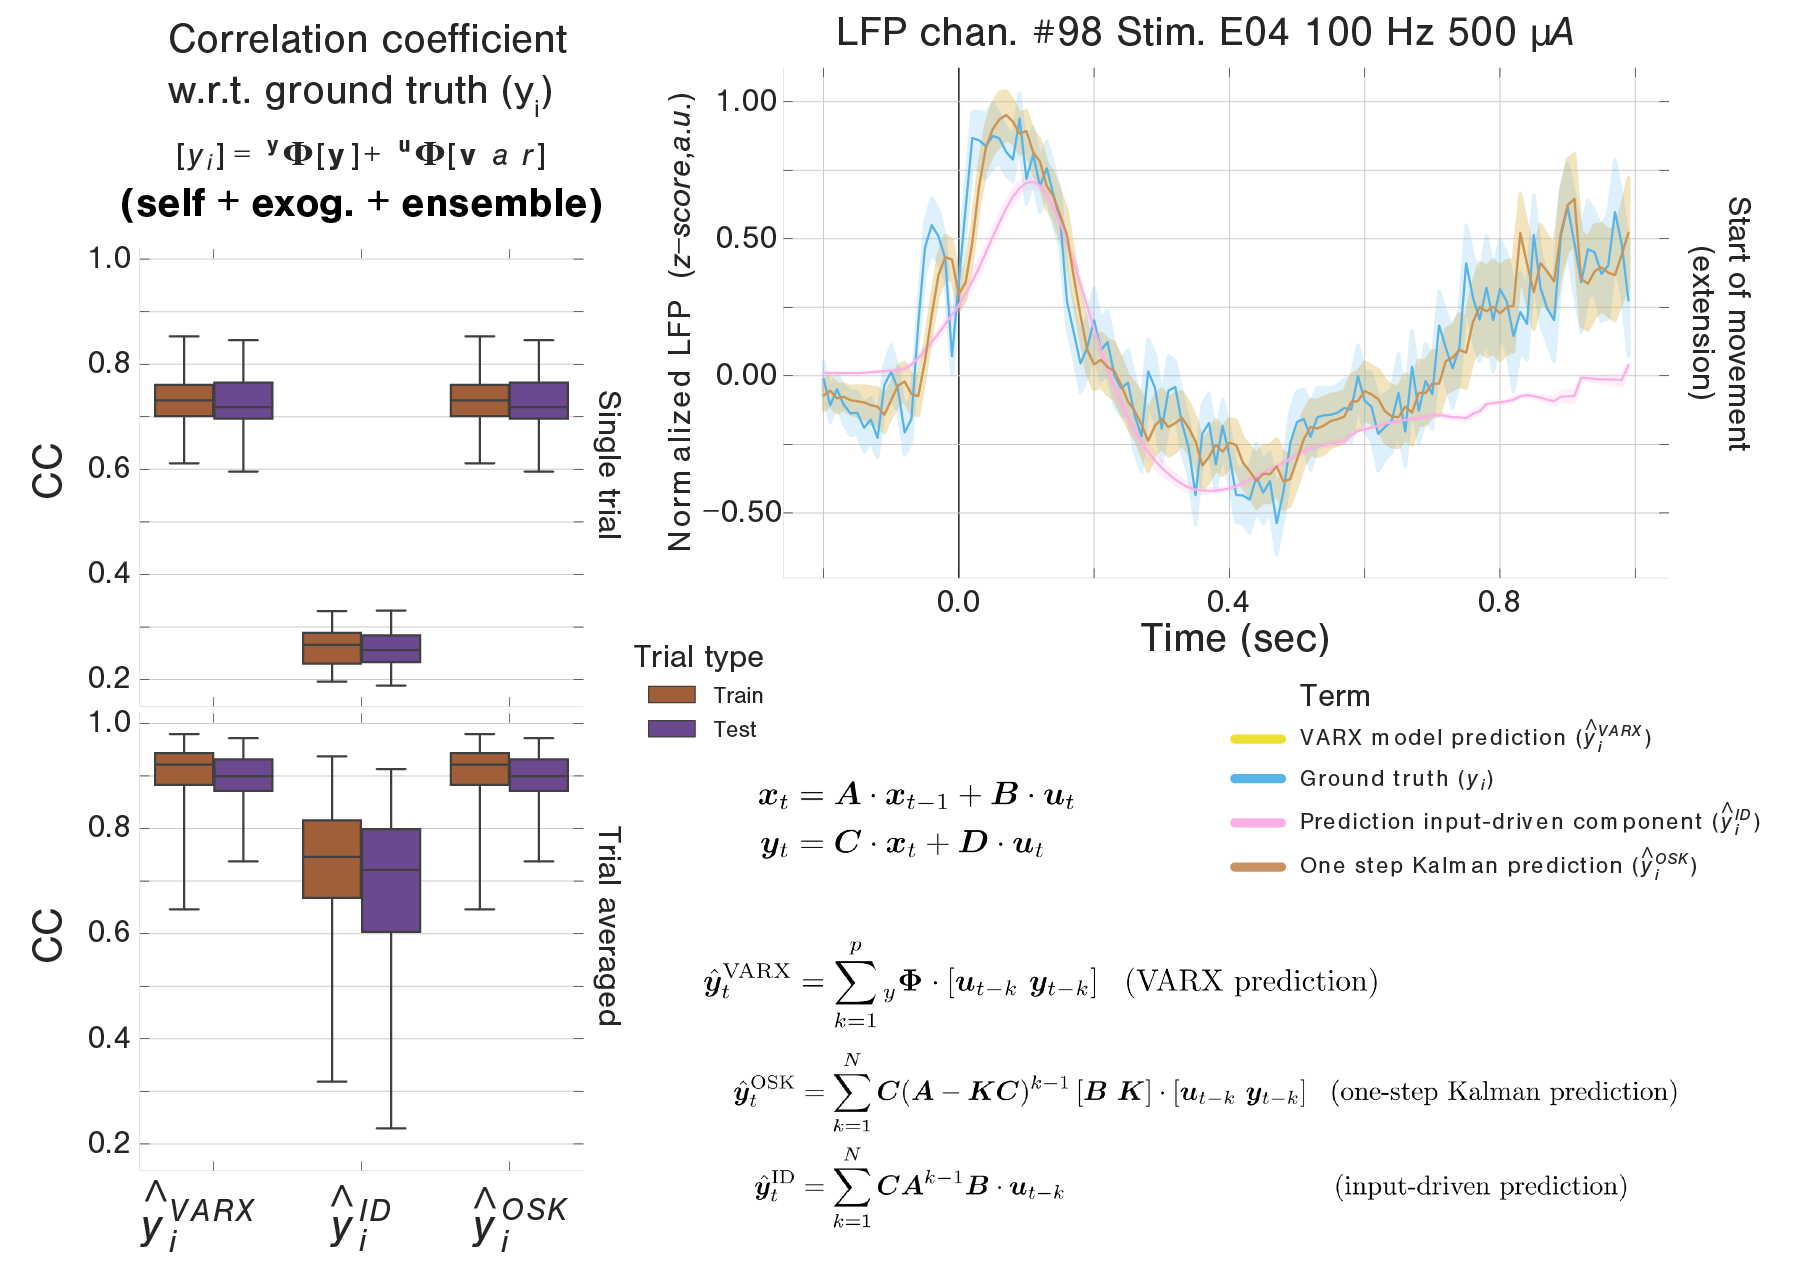
A Correlation coefficients between predicted and ground-truth LFP derived from the original full linear VARX model, the input driven portion of the state-space prediction, or the full state-space prediction. B Illustration, for one example LFP channel, of the trial averaged ground-truth evoked potential, along with the three types of trial-averaged prediction (VARX, input-driven, one-step Kalman filter prediction). All traces represent the mean across trials and are shaded to reflect ± one standard error of the mean. C Correlation coefficients between predictions derived from the state-space model and predictions derived from their parent VARX model.